PC3000 → HTML Report
Build a self-contained HTML folder explorer from a PC3000 recovery CSV or an .acerep file-selection report — open offline or share.
Ever have a data recovery case where you are part way through a very tough job, imaging with Data Extractor, and want to give your customer an easy-to-view HTML report of which files have been successfully imaged and which are still bad due to unread or damaged sectors?
It is for that reason that we developed this. Have fun!
Need the customer to choose which files and folders to recover from a Data Extractor snapshot — without giving them PC3000 — then bring that selection back as a .roa Import report?
Import the .acerep, brand an HTML picker, let them select, and export a .roa for Data Extractor.
Build an offline HTML sector map (LBA 0 at top-left) from a Data Extractor Attr.map. Toggle the full DE legend or a simple Good / Bad / Unread view.
Optionally add Head.map (filter by head) and task.info (patient model & S/N).
Have an R-Studio (or DeepSpar) HTML recovery list and want the same offline good/bad folder explorer we build from a PC3000 CSV?
Drop the R-Studio report HTML here — we convert it as best we can into that status report format.
Saved recovered files into Good and Damaged folders on the destination drive? Build the same color-coded status report from a DOS dir /a /s listing — merged back into the original tree.
After import, pick Good/Damaged folders when they exist — or treat the whole listing as all good, all damaged, or all unknown. Nested bad-inside-good (or the reverse) is detected automatically.
Have a UFS Explorer HTML scan report? Convert it into the same offline good/bad folder explorer — and drop the damaged-objects text report when you have it.
Without a damage report, choose to treat every file as good or as unverified.
Have a Snap2HTML report of a volume or recovered tree and want it in the same branded explorer as our other reports?
Drop the Snap2HTML HTML here — we import the folder tree as a directory snapshot (no good/bad coloring).
We generate customer-facing HTML recovery reports (status, file selection, sector maps, and more). Those reports can show your company name, logo, colors, and contact details.
Fill in the form below, download the JSON file, and email it back to us. Nothing is uploaded from this page.
How it works
- Add your company name, logo, contact details, and a color scheme. This is what customers see on the HTML reports.
- Optionally set a selection-return email only if you receive customer file-selection emails yourself. Leave it blank if we should use our lab address.
- Click Download branding JSON. Your browser saves a
.jsonfile (it includes the logo). - Email that file back to us. We import it when generating reports for your jobs.
Keep a copy of the JSON. If you change your logo or colors later, send an updated file.
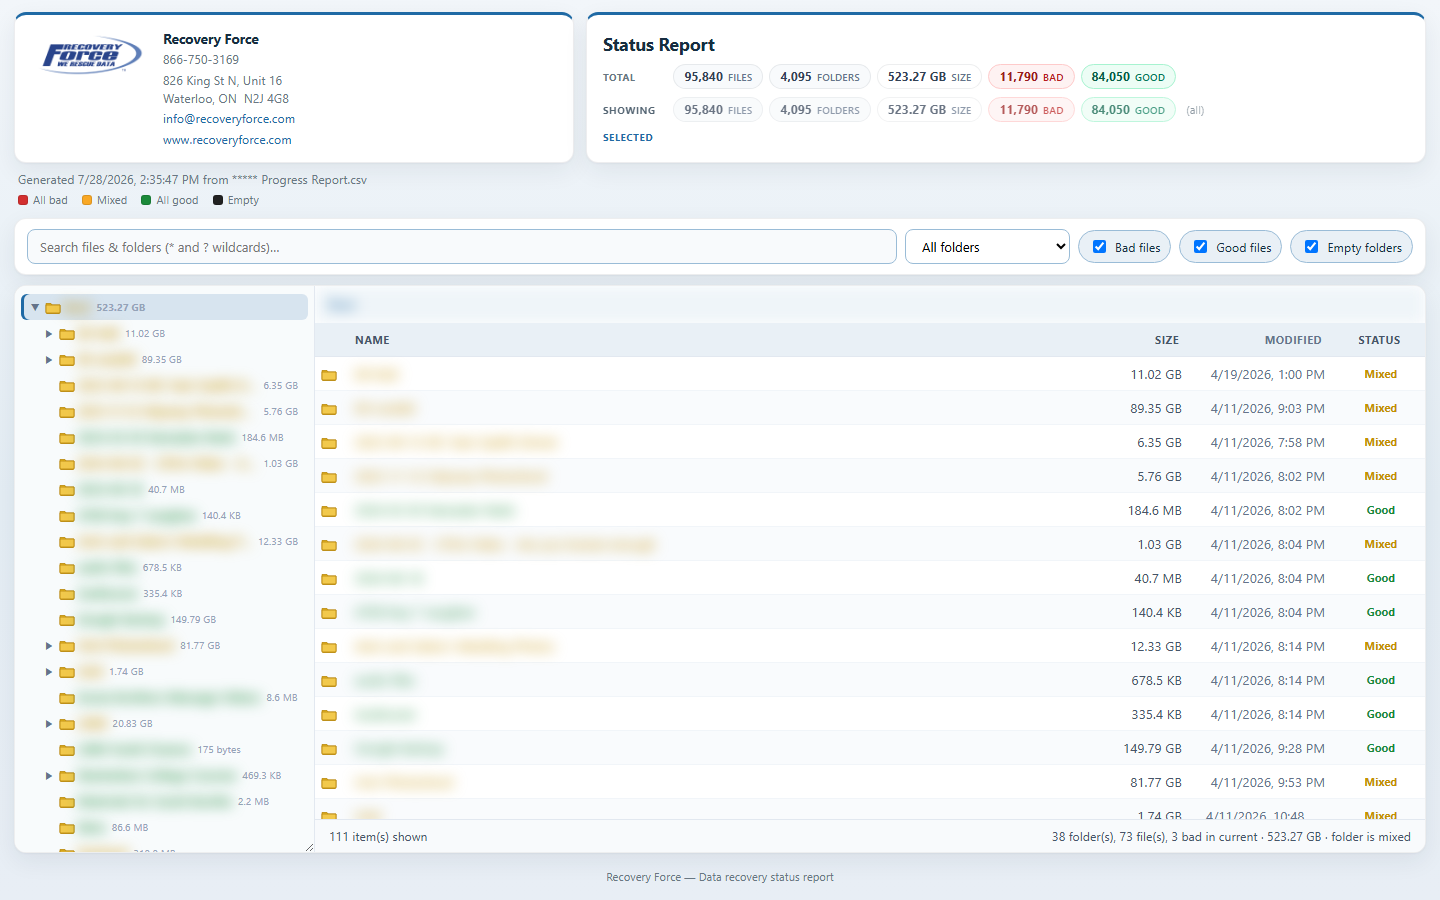
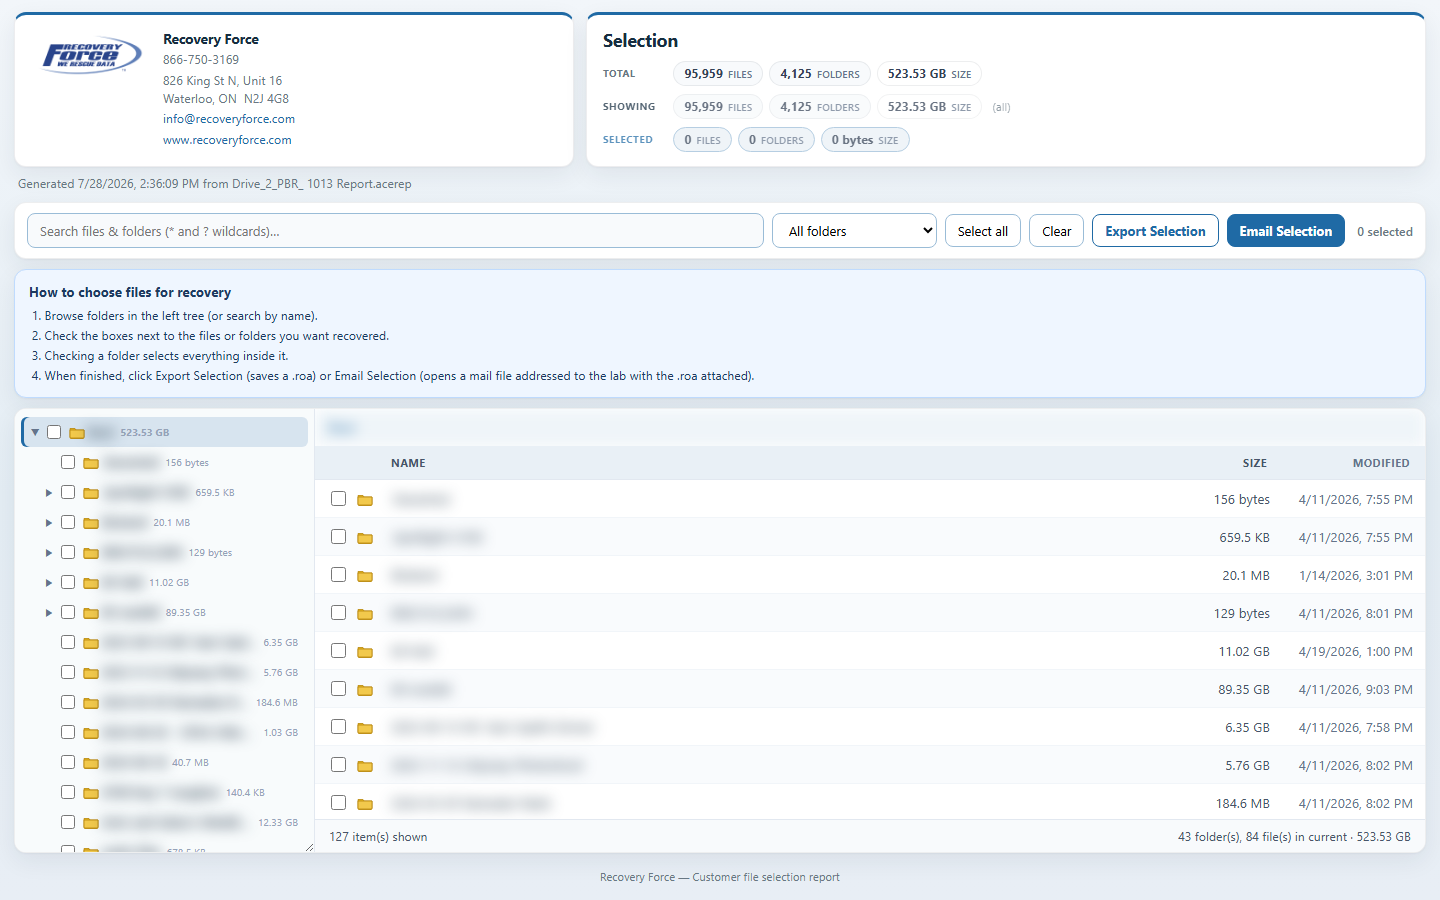
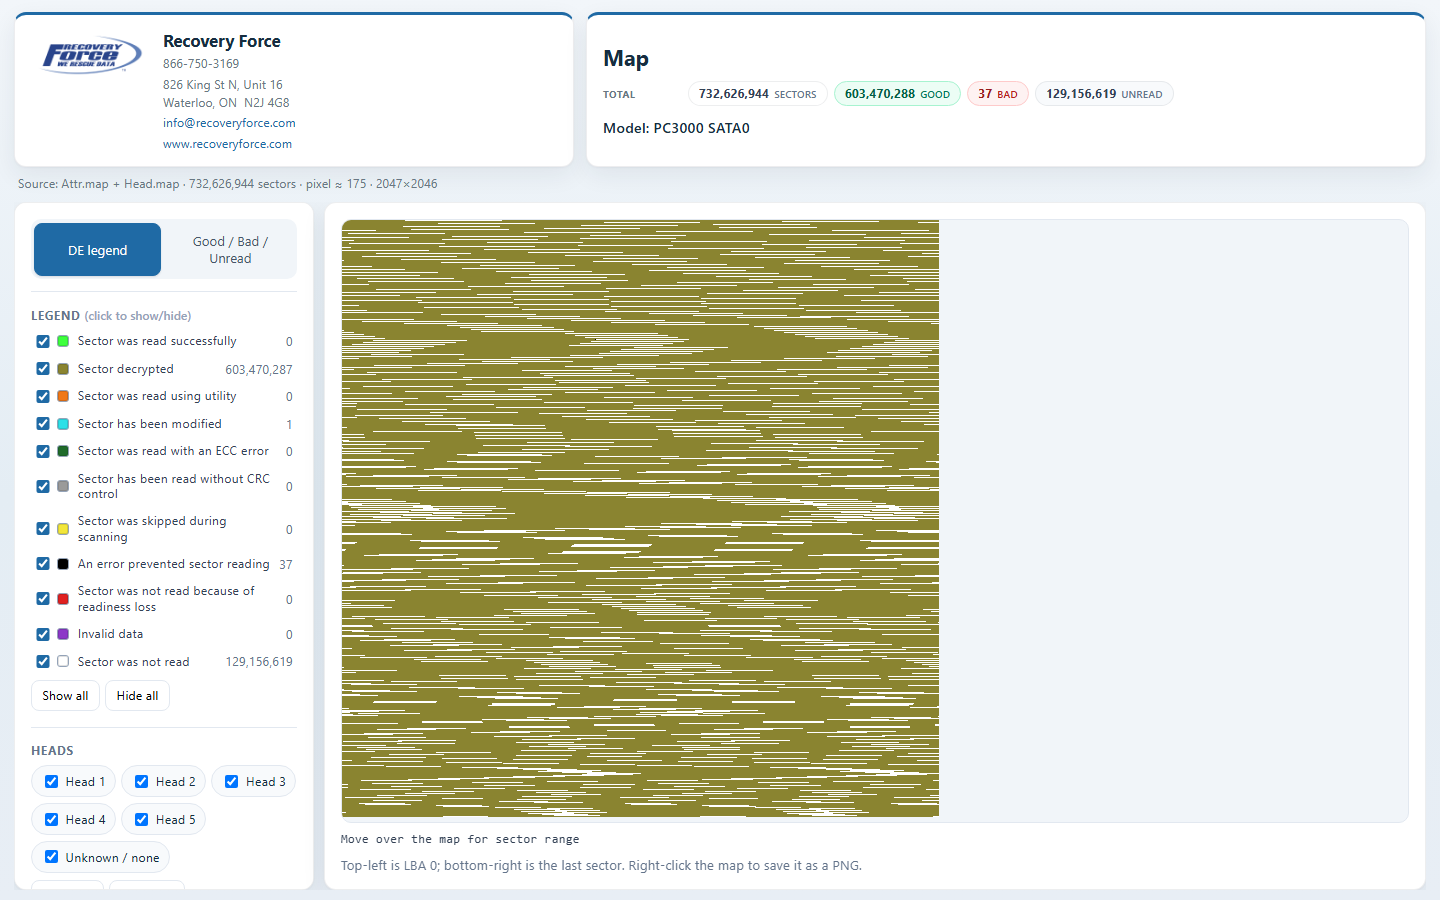
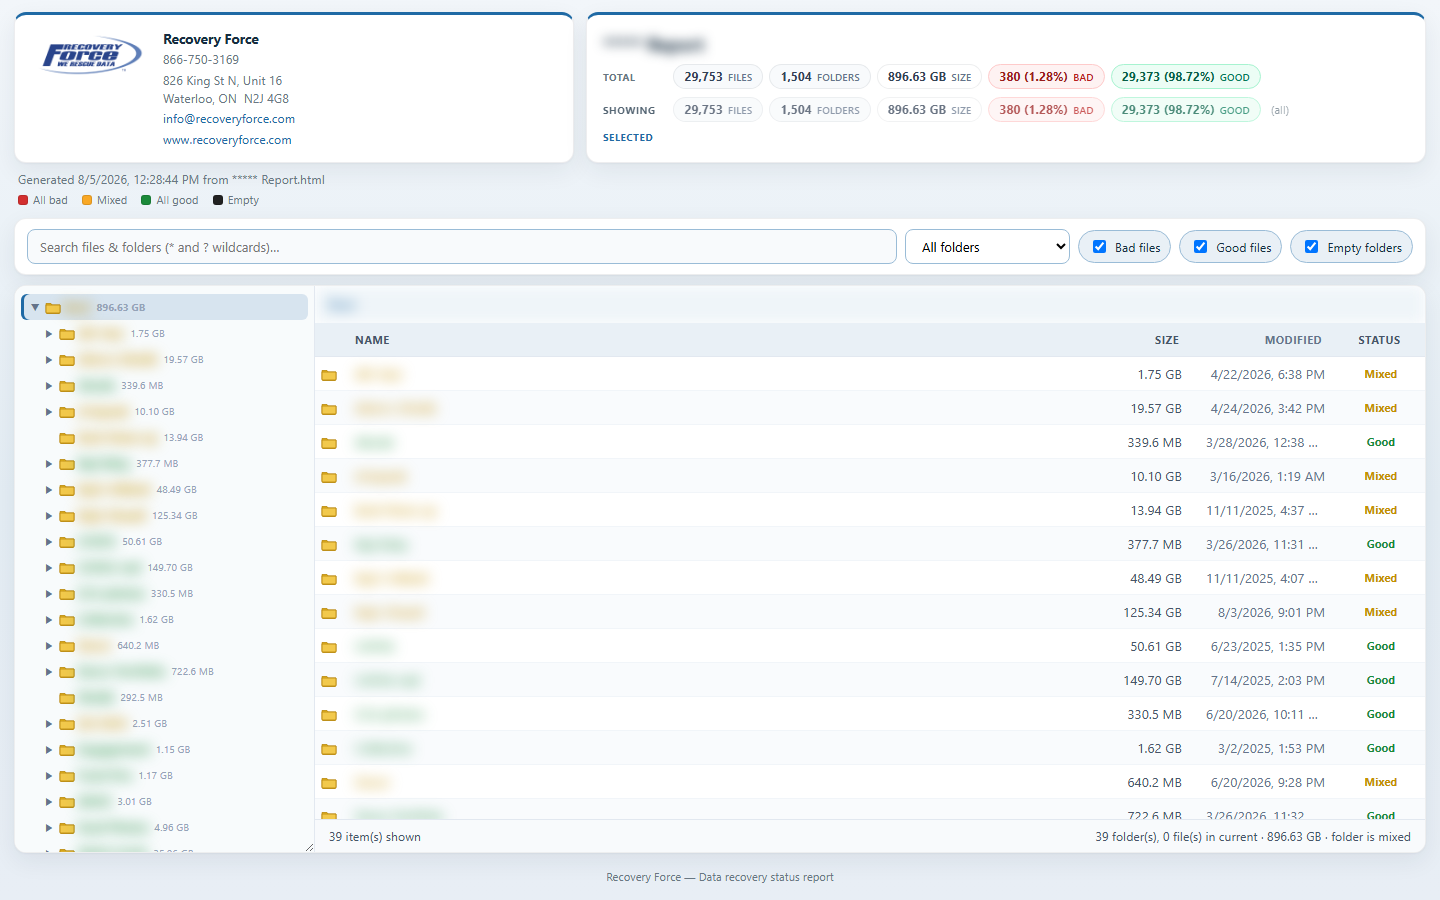
1. Export a CSV from PC3000
- In PC3000, right-click the Root folder and select Export file list.
- Leave everything at the defaults and select Map statistics.
- Click OK to save the file list as a CSV.
The export is semicolon-delimited and includes size, dates, absent sectors, and problem sectors. If Map statistics are omitted, every file is listed as unverified.
2. Build an HTML report here
- Drop the CSV onto the box below (or click to browse and select it).
- Set a report title — this is also the download filename. If left blank, you will be prompted.
- Optionally open Report branding & colors to add a logo, company/contact details, and a color scheme.
- Click Preview in New Tab to check the report, or Generate & Download HTML to save it.
- Open the downloaded
.htmlfile in any browser — no internet or this site required.
Chinese / Japanese / Korean names need a Unicode-preserving source. PC3000 CSV on a Western Windows code page often replaces them with ???? before this tool ever sees the file. Prefer UTF-8/Unicode CSV, an .acerep, or a UFS / R-Studio HTML report.
3. Using the HTML report
- Browse folders in the left tree; open a folder to see its files on the right.
- Use search (supports
*and?wildcards) and the scope dropdown to limit results. - Toggle Bad files, Good files, and Empty folders to filter the view.
- Files with missing sectors or bad/problem sectors are treated as bad. Without Map statistics, every file is unverified.
Customer file selection — how it works
- In Data Extractor, export a snapshot report as
.acerep. - Drop the
.acereponto the box below (or click to browse). - Set a report title / branding and the Selection return email (lab inbox for Email Selection), then preview or download the HTML picker.
- Customer opens the HTML offline, checks the files/folders they want, then clicks Export Selection or Email Selection.
- In Data Extractor, use Import report with the .roa to apply their selection.
Plain SQLite and zlib-compressed .acerep files are both supported. Nothing is uploaded — files stay in the browser.
Sector map — how it works
- Close the task in Data Extractor (or copy files from the task folder) so they are not locked.
- Drop
Attr.map(required). Optionally dropHead.mapand/ortask.infowith it, or one file at a time. - Optionally open Report branding & colors, set a title, then preview or download the HTML map.
- In the report: toggle DE legend vs Good/Bad/Unread, show/hide colors, zoom/pan, and filter by head when Head.map was included.
Bad includes ECC, no-CRC, invalid, read errors, and readiness loss. task.info supplies patient model & S/N.
R-Studio recovery list — how it works
- In R-Studio, create a Recovery List / HTML report of the files you care about (with bad-sector / recovery-chance columns when available).
- Drop that
.htmlfile onto the box below (or click to browse). - Set a report title and optional branding. Optionally enable customer file selection (exports an R-Studio recovery-list
.txt— no need for Mark Files in the source HTML). - Files with a bad-sector count (or a Bad / Below Average recovery rating) are marked bad; others are good.
This is a best-effort conversion of R-Studio’s embedded file tree. Symlink-style entries without content are skipped. R-Studio does not expose PC3000 “absent sectors” the same way.
Good / Damaged dir listing — how it works
- On the destination media, keep damaged files under a folder such as Damaged / Bad and healthy files under Good (any names are fine).
- From a command prompt at the job folder, run
dir /a /s > report.txt. - Drop that
.txthere. If Good/Damaged folders are present, pick them (guesses fill in when names look familiar). If not, treat the whole listing as All good, All damaged, or All unknown. - Preview or download: split listings show the original tree with wrappers removed; assume-all listings keep the tree as listed.
If Bad is inside Good (or the reverse), the more specific path wins. Works with English and common localized dir headers.
UFS Explorer report — how it works
- In UFS Explorer, export the HTML report of the scan result volume.
- Optionally export / save the damaged objects text report (lists bad file IDs).
- Drop the
.html(required). Drop the damage.txtwith it or afterward. - Optionally enable customer file selection (exports UFS
.xsdf). If no damage report is provided, choose All good or All unverified, then preview or download.
Bad files are matched by UFS object ID from the damage report. The HTML tree alone has no good/bad flags.
Snap2HTML report — how it works
- In Snap2HTML, generate a report of the folder you want to share.
- Drop that
.htmlfile onto the box below (or click to browse). You can drop it on any mode — Snap2HTML is detected automatically. - Set a report title and optional branding, then preview or download.
- The generated report is a directory snapshot: sizes and dates, without good/bad recovery flags.
This imports Snap2HTML’s dirs[] tree. It is not a PC3000 status report — files are not marked good or bad.
Required for each report. Cleared after generate so the next job gets a fresh name.
If the listing has Good and Damaged folders, pick them below. Otherwise treat every file as good, damaged, or unknown.
No damaged-objects file loaded. Choose how to treat all files:
When the customer clicks Email Selection, this address is used as To: and the selection file is attached (via a downloadable .eml).
Report branding & colors (optional)
Use line breaks for street / city lines — they show separately from phone, email, and website.
Quick presets — or use the color wheel below for any brand color.
Save your logo, colors, and contact details to reuse on another computer.
Usage
Loading usage stats…